TSBTV#3 - Automatic or Manual?
Posted on: January 13, 2009
 del.icio.us
 blinklist
 digg
digg Facebook
 Furl
Furl ma.gnolia
 Newsvine
 Pownce
 reddit
 StumbleUpon
 Technorati
 Twitter
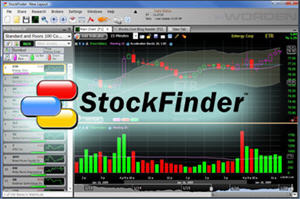
One thing I’m asked quite often is, “how do you find the setups you trade…do you run a screen for certain criteria?”
Although I’d like to reply that I do in fact have a neat little machine do the work for me, the fact of the matter is that only certain things can be programmed into a PC to locate for you. Charting programs require that you define what it is you’re looking for, and only some of the patterns I trade fit into that mold.
Breakouts, for example, are easy to find using a charting program. I can define a breakout as the highest high over ‘X’ number of days. Breakdowns can also be quantified in a standardized way, specifying the lowest low in ‘X’ number of days.
But I trade a variety of chart patterns, and a lot of them require eyeballing. A rounded top, for example, isn’t easily defined in mathematical terms, but you sure know one when you see it on a chart don’t you? And the bull flags that we discussed in Episode 2 … they have a standardized appearance, but the actual criteria is going to vary from chart to chart.
So for me, it boils down to some good old fashioned hard work. In this video I talk a little about how I do that.
(Be sure to click the full-screen option for best viewing.)
Hope you enjoy the show! Thanks for watching and subscribing, and feel free to post your ideas and comments down below.
Trade like a Bandit!
Jeff White
President, TheStockBandit, Inc.
www.TheStockBandit.com (Premium service)
www.TheStockBandit.net (Trading Blog)